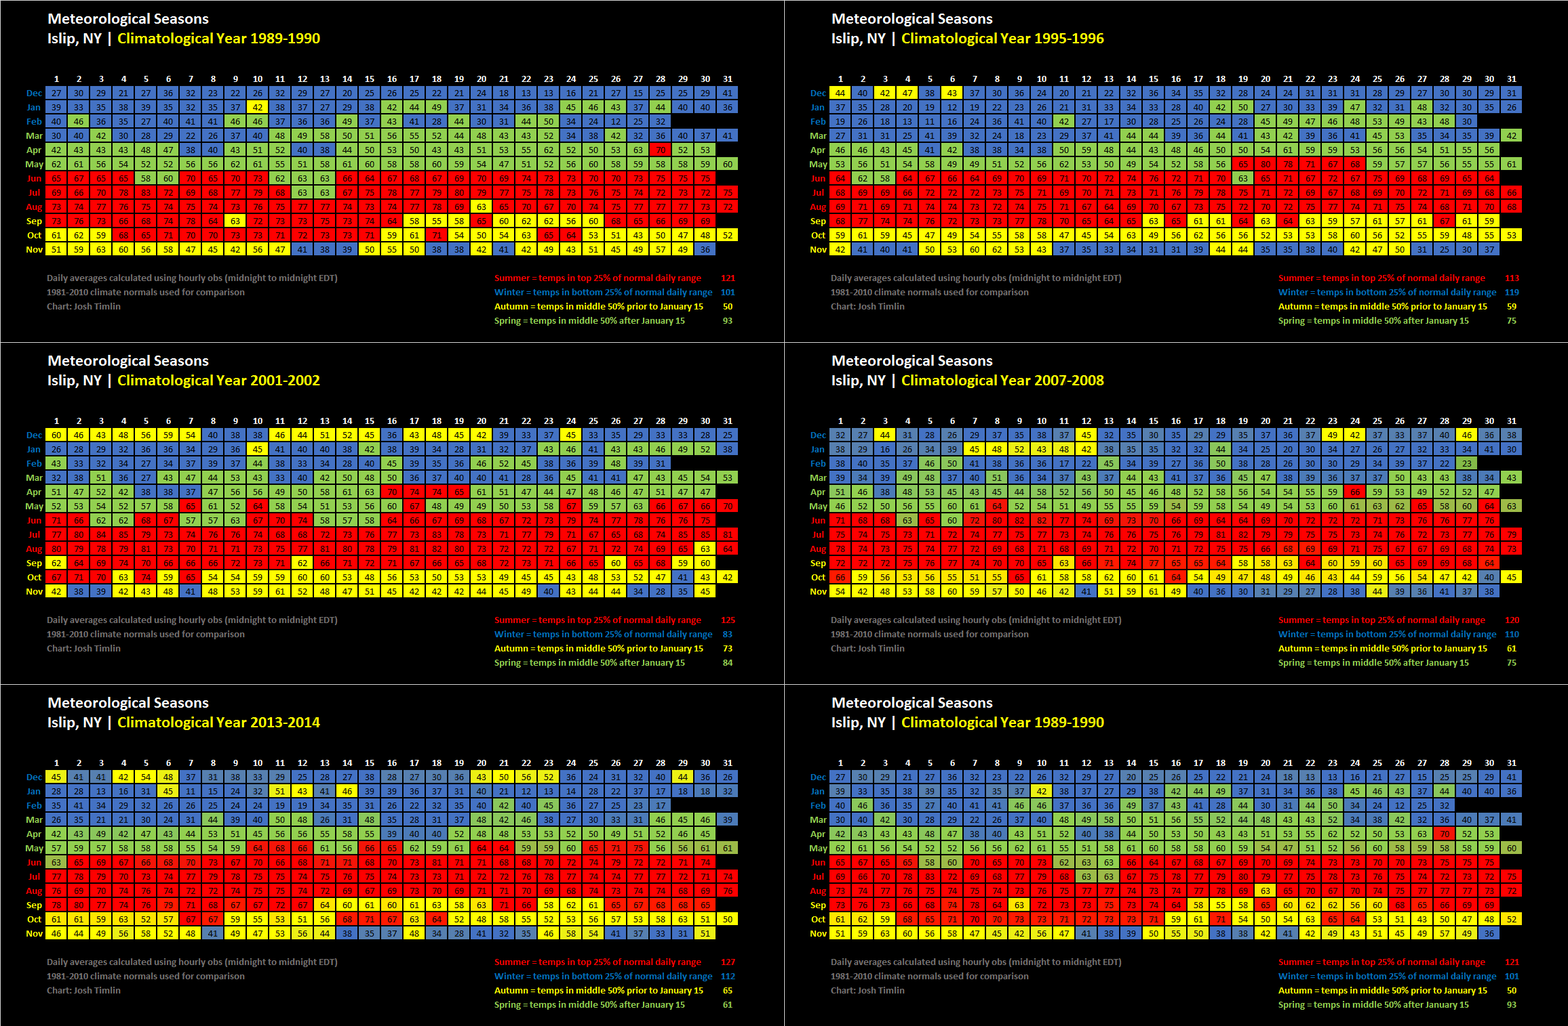
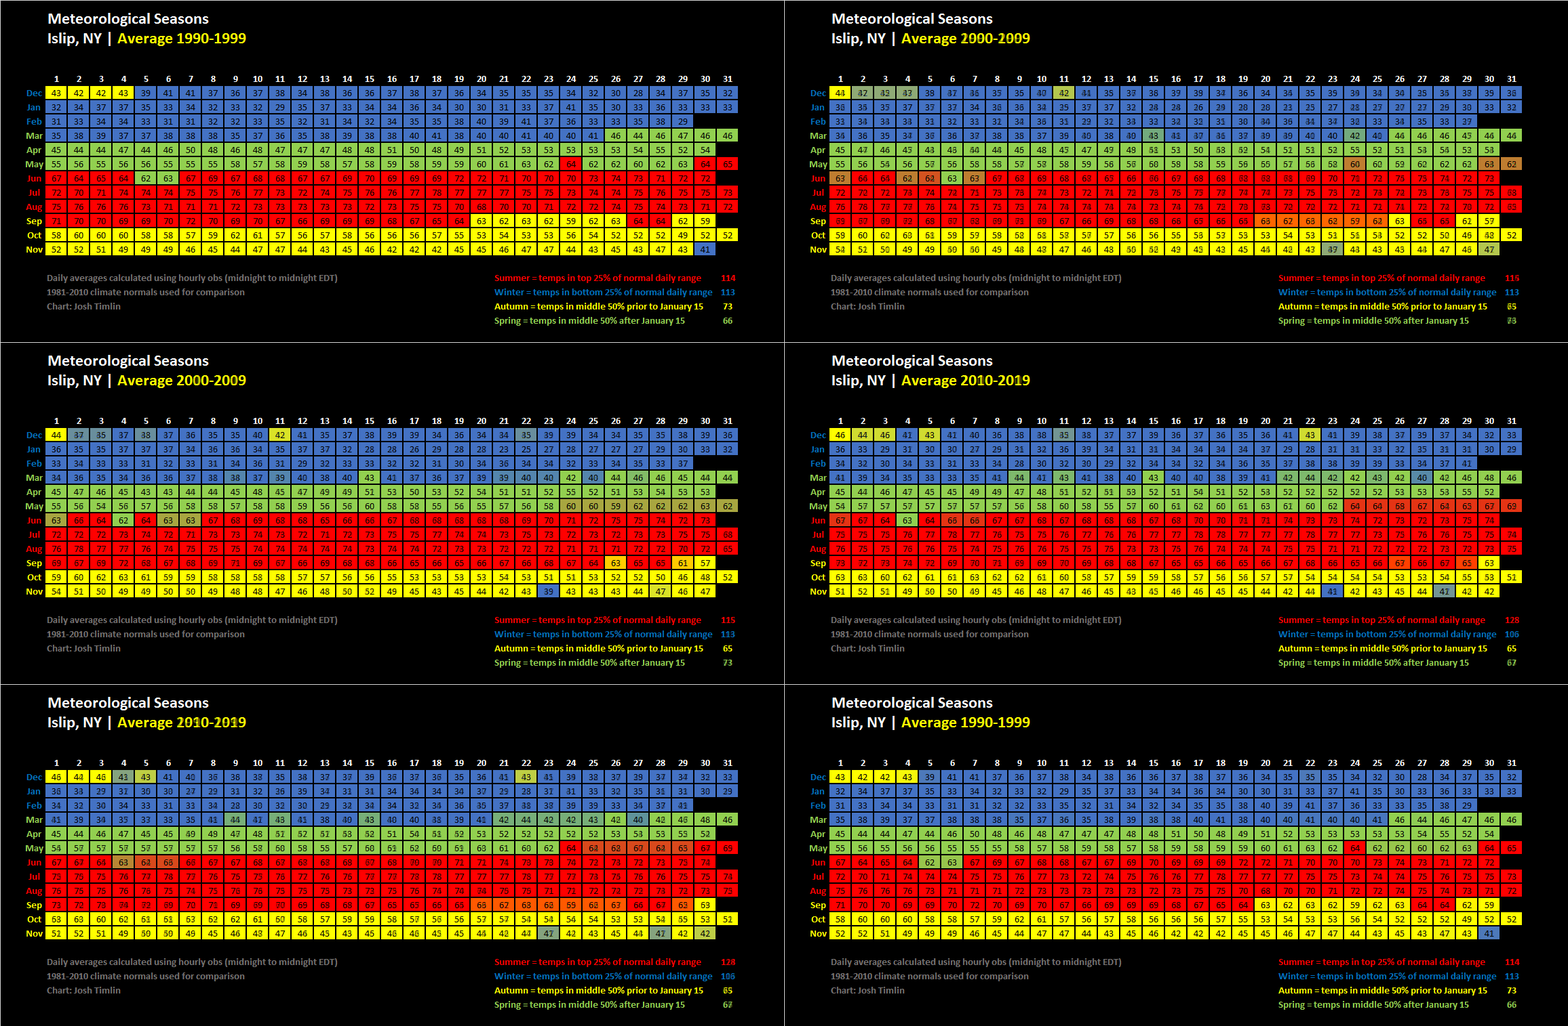
The use of the term “meteorological seasons” to describe climatological seasons has bugged me for some time. Meteorologists, climatologists, and educators go to great lengths to differentiate weather from climate, often using analogies such as “weather is like your mood, climate is like your personality”. However, when it comes time to announce the arrival of a new climatological season you tend see the term meteorological season used more often than not. This got me thinking- what would the term meteorological season actually be useful for?
Methodology
There are a few different ways one could go about defining the number of days in a season. In the case of defining how the day’s weather fits into a defined seasonal framework we need to consider two main questions:
-
What are the average daily temperature thresholds that differentiate winter and summer from the transitional seasons?
-
For days that fall in the middle between winter and summer, what are the dates that determine whether that day is classified as spring or autumn?
All charts shown here for Islip, NY were created using the following method. First, I used the average high and low temperature for each day of the year according to 1981-2010 climatology to calculate each day’s average daily temperature. The daily averages ranged from 30.5°F on the coldest days of the year in January to 74.5°F on the warmest days of the year in July. Viewing this range between the highest and lowest average of 44°F as the normal spread for the four seasons and dividing it into four equal parts we get:
Summer = temps in top 25% of normal daily range (≥63.5°F)
Winter = temps in lowest 25% of normal daily range (≤41.5°F)
Autumn = temps in middle 50% between July 16 and January 15
Spring = temps in the middle 50% between January 16 and July 15
As for the boundaries between spring and autumn days, I used the midpoint of the traditional climatological seasons. For this study spring days can occur from Jan 16 through July 15. Autumn days can occur between July 16 and Jan 15.
It should also be clarified that the calculation of the daily averages for all of the days from 1990-2019 were made using an average of all 24 hourly observations for that day (midnight to midnight local time). This is not the most common way that daily averages are calculated. Most of the time an average of the high and low temperature for the day are used (similar to what I did to establish the daily averages as detailed above). These two methods do not produce significant differences in the classification of days using the methods described above.
When the seasons happen - a probabilistic view...
From a climatological perspective the seasons in the Northern Hemisphere are chunked into 3-month long periods with winter running from December-February, spring from March-May, summer from June-August, and autumn from September-November. On any given year, however, the days on which we experience weather typical of a given season are not confined to those neat boxes. The charts below attempt to shed some light on when weather typical of each season is most likely to occur.
Summary of Seasonal Length
Here's a concise view of the relative length of each season in Islip, NY from 1990-2019. As can be seen on the charts for each individual year, these days did not occur consecutively despite the appearance on the graph - the bars merely show the total number of days in each season regardless of when they occurred.
Trends
Recent trends in seasonal length show an increasing number of summer days. This seems to be coming mostly at the expense of spring and autumn days which have shown the greatest decline over the past 30 years. There has been a only slight decrease in winter days, and it remains the most variable season from year to year.
Full History 1990-2019
A gif of all 30 years in this study is shown below. For a closer look at any individual year click on the desired year(s) in the lists below.

Originally posted: 12/28/19
Last modified: 12/30/19


.png)

